
Executive cockpit
Every headline figure on one screen: revenue, collections, outstanding, occupancy, admissions, average stay, discount and expense — each one clickable.
Not a template pack. Every metric maps to a field your system already fills, and every tile drills down to the transaction underneath it.
Where the revenue is, where it leaks and what is still owed.
Every headline figure on one screen: revenue, collections, outstanding, occupancy, admissions, average stay, discount and expense — each one clickable.
Revenue by service group, item, department, doctor, ward, payer and hour of day. Gross to net bridge. Top and bottom performers. Rate overrides against the master.
Daily collection by mode, cashier, counter and shift. Cash against digital. Refunds. Deposits against adjustments. Bank instrument clearing.
Discharged-not-billed with ageing. Charge capture lag. Receivables in 30/60/90 buckets. Collection efficiency and days sales outstanding.
Volume, revenue and realisation by payer. Multi-payer admissions. Approved against billed. Deduction patterns and settlement days.
Income against expense by account head, department and branch. Voucher-level drill. TDS summary. Full EBITDA once overheads and payroll are loaded.
Whether the hospital is running well today, not last month.
Occupancy by ward, class, floor and ICU. Bed turnover and turnaround interval. Bed-day revenue. Transfer patterns. Live census.
Average stay by specialty, doctor, ward, payer, diagnosis and age band. Outlier stays. Discharge mix including LAMA and mortality. Discharge-by-noon.
Footfall, new against revisit, slot utilisation, department mix, OPD to IPD conversion and the hourly load curve.
Median and 90th percentile against SLA for registration, consultation, sample to report, radiology reporting and discharge to physical exit. Breach lists.
Test volume by test and machine. Sample rejection rate and reasons. Recollection rate. Send-out share. Authentication pendency.
Study volume by modality and referring doctor. Reporting pendency and radiologist load. Cancelled studies. Revenue per modality.
Case mix, quality and where the patients come from.
Volume by procedure, surgeon, anaesthetist and anaesthesia type. Surgery revenue and surgeon case mix. Utilisation and first-case on-time start where the OT module is in use.
ICD-wise volume, revenue, stay, mortality and readmission. Disease against age, gender, geography and season. Comorbidity pairs.
Mortality, LAMA, readmission, sample rejection, MLC volume. Hospital-acquired infection rates and incident register once loaded.
Age and gender pyramid. Income group, occupation and education cuts. New against repeat. Geographic heat map and catchment radius.
Referrer scorecard: patients, revenue, conversion, stay, payout and a dormancy alert. Source mix and referral revenue trend.
Revenue generated direct and induced, volume, stay, case mix, surgery count. Full incentive engine with pool, consultant share, hospital charge and TDS.
The dashboards nobody asks for and everybody needs.
Bills modified after saving, with user and reason. Cancelled bills by user. Back-dated postings. Discounts beyond authority. Rate overrides. Cash short and excess.
Sales, margin, returns and cancellations. Generic against branded. Schedule-H control. Batch and expiry exposure. GST summary. Prescription to sale conversion.
Stock value by store and category. Expiry exposure at 30, 60 and 90 days. Non-moving and dead stock. Reorder breaches. Consumption per bed day.
Purchase value by supplier. Price variance against the master. Credit terms exposure and vendor ageing. MSME compliance. Concentration risk.
Headcount by department, grade, shift and cost centre. Attrition and tenure. Nurse-to-bed ratio. Manpower cost as a share of revenue once payroll is loaded.
Unit against unit on every metric. Consolidated group P&L. Cross-unit patient movement. Standardisation gaps where the same service is priced differently.
An internal console, not a management dashboard.
Fill-rate monitoring on every field the dashboards depend on, duplicate master data, orphan records, reconciliation breaks and import freshness. Where a dashboard cannot be supported by your data today, Prism says so instead of producing a confident wrong number.
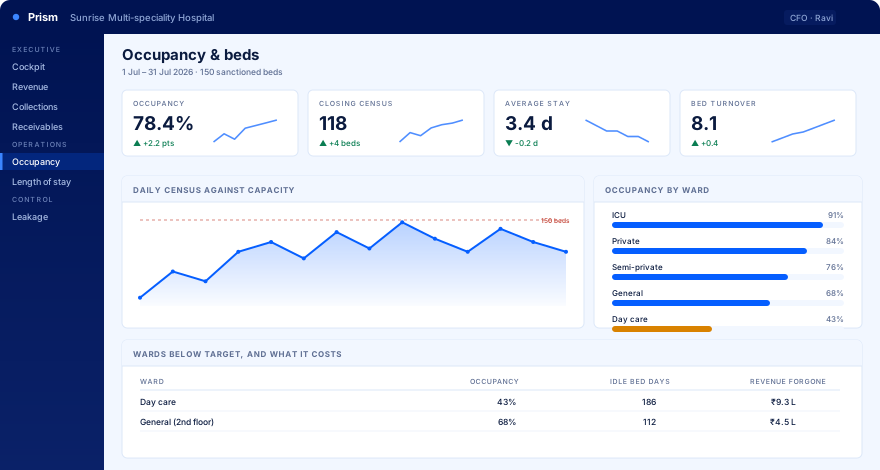
Occupancy & beds
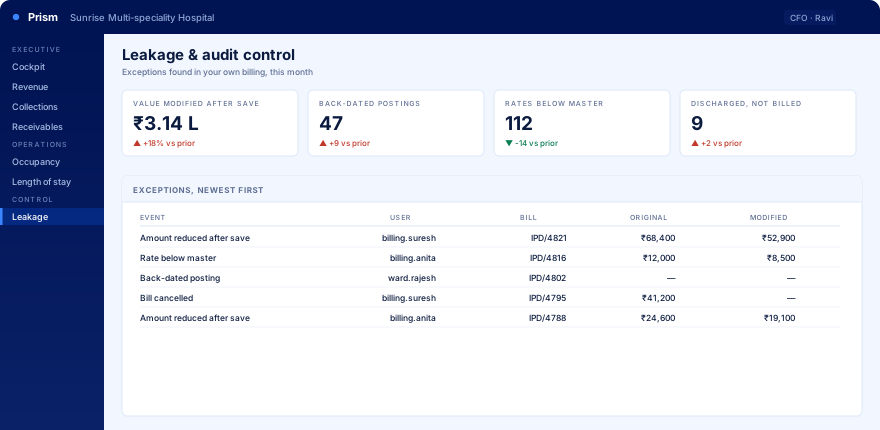
Leakage & audit control
Illustrative data. In a pilot these are built on yours.
The 27 dashboards are curated entry points, not the limit. The drill engine composes combinations at runtime.
One hospital, one month of your data, and the exception list from your own billing.