
Reports & KPIs
Everything it reports, and everything else you can ask for
27 dashboards and 49 measures ship ready to use. Anything not on this list, your team types as a question and gets back as a report — which is why the list below is a starting point rather than a limit.
Beyond the list
Ask for a report that does not exist yet
Type a question in plain English. Prism writes the query against your own governed data, returns a table or a chart, and lets you pin it as a permanent dashboard tile.
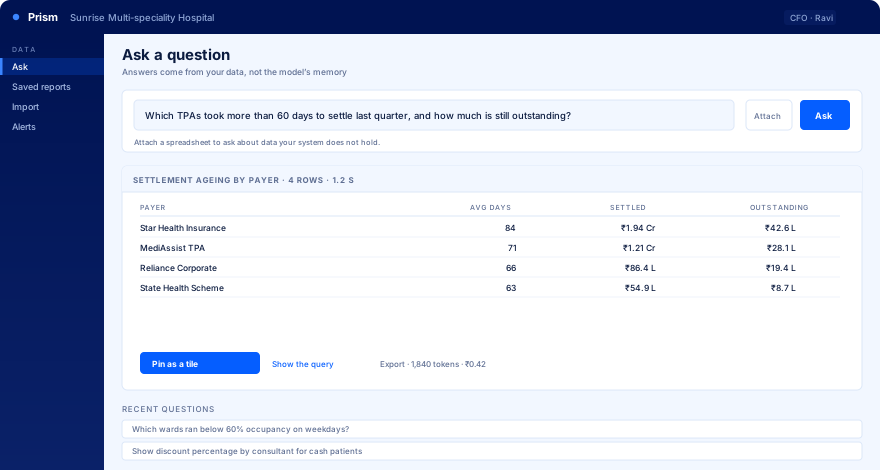
Illustrative. Figures shown are sample data.
The catalogue
Ready on day one
Every dashboard below drills from the headline figure down to the individual transaction behind it.
Executive
Multi-unit rollup
Forecast & anomalies
Finance
Revenue analytics
Gross revenue · Net revenue · Discount given · Discount % · Contribution margin …
Collections & cash
Gross revenue · Net revenue · Discount given · Discount % · Contribution margin …
Revenue cycle management
Gross revenue · Net revenue · Discount given · Discount % · Contribution margin …
Payer / TPA performance
Gross revenue · Net revenue · Discount given · Discount % · Contribution margin …
P&L and expense
Gross revenue · Net revenue · Discount given · Discount % · Contribution margin …
Operations
Occupancy & beds
Admissions · Discharges · Average length of stay · Occupied bed days · Occupancy % …
Length of stay & discharge
Admissions · Discharges · Average length of stay · Occupied bed days · Occupancy % …
OPD & appointments
Admissions · Discharges · Average length of stay · Occupied bed days · Occupancy % …
Turnaround time
Admissions · Discharges · Average length of stay · Occupied bed days · Occupancy % …
Diagnostics
Laboratory
Lab tests · Sample rejection % · Lab TAT · Lab within SLA %
Radiology
Lab tests · Sample rejection % · Lab TAT · Lab within SLA %
Clinical
OT & surgery
Mortality % · LAMA / DAMA % · 30-day readmissions · Surgeries
Disease & case mix
Mortality % · LAMA / DAMA % · 30-day readmissions · Surgeries
Clinical quality & NABH
Mortality % · LAMA / DAMA % · 30-day readmissions · Surgeries
Growth
Demographics & catchment
Doctor payout · Referral payout
Referral & source
Doctor payout · Referral payout
Doctor scorecard & payout
Doctor payout · Referral payout
Supply
Pharmacy
Pharmacy sales · Pharmacy margin · Pharmacy margin % · Stock value · Stock expiring in 90 days …
Inventory & stores
Pharmacy sales · Pharmacy margin · Pharmacy margin % · Stock value · Stock expiring in 90 days …
Purchase & vendor
Pharmacy sales · Pharmacy margin · Pharmacy margin % · Stock value · Stock expiring in 90 days …
People
HR & manpower
Would recommend %
Patient experience
Would recommend %
Governance
Leakage, loss & audit
Value modified after save · Back-dated postings · Cancelled bills · Rate overrides vs master
Data readiness console
Value modified after save · Back-dated postings · Cancelled bills · Rate overrides vs master
Every measure, in full
| Measure | Area | What it tells you |
|---|---|---|
| Gross revenue | Finance | Total billed value before discount |
| Net revenue | Finance | Billed value after discount and surcharge |
| Discount given | Finance | Value discounted, by whoever approved it |
| Discount % | Finance | Discount as a share of gross billing |
| Contribution margin | Finance | Net revenue less standard cost |
| Collections | Finance | Money received across all five counters |
| Net cash | Finance | Cash collected less cash refunds |
| Grand collection | Finance | All collection less all refunds |
| Digital collection % | Finance | Share taken by UPI, card and transfer |
| TCS collected | Finance | Tax collected at source |
| TPA deduction | Finance | Amount the payer disallowed |
| TDS withheld | Finance | Tax deducted at source by the payer |
| Outstanding (AR) | Finance | Collectable balance, net of deduction and TDS |
| Bills with no receipt raised | Finance | Unpaid bills never receipted |
| Bills part-receipted but unpaid | Finance | Partial collection outstanding |
| Total expense | Finance | Expense by head, cost centre and department |
| Other income | Finance | Non-clinical income |
| Admissions | Operations | Inpatient admissions |
| Discharges | Operations | Inpatient discharges |
| Average length of stay | Operations | Mean stay in days |
| Occupied bed days | Operations | Bed nights used |
| Occupancy % | Operations | Beds occupied against beds available |
| Occupancy % (hospital definition) | Operations | Running census over bed master count |
| Closing census | Operations | Patients in beds at end of day |
| Bed capacity | Operations | Beds in the master, snapshotted daily |
| Discharge to final bill | Operations | Minutes from system discharge to bill |
| Discharge to physical exit | Operations | Minutes from discharge to the patient leaving |
| Mortality % | Clinical | Deaths as a share of discharges |
| LAMA / DAMA % | Clinical | Patients leaving against advice |
| 30-day readmissions | Clinical | Same patient back within 30 days |
| Surgeries | Clinical | Procedures performed |
| Lab tests | Diagnostics | Test volume |
| Sample rejection % | Diagnostics | Samples rejected, with reasons |
| Lab TAT | Diagnostics | Median turnaround in minutes |
| Lab within SLA % | Diagnostics | Reports inside the agreed turnaround |
| Pharmacy sales | Supply | Sale value at line grain |
| Pharmacy margin | Supply | Sale less purchase cost per line |
| Pharmacy margin % | Supply | Margin as a share of sale value |
| Stock value | Supply | Value held across stores |
| Stock expiring in 90 days | Supply | Value at risk of write-off |
| Stock with no movement 180d | Supply | Dead stock at value |
| Consumption value | Supply | Consumables used by department and ward |
| Doctor payout | Growth | Consultant incentive payable |
| Referral payout | Growth | Referrer incentive payable |
| Value modified after save | Governance | Bills changed after entry |
| Back-dated postings | Governance | Charges posted after the bill date |
| Cancelled bills | Governance | Cancellations by user and reason |
| Rate overrides vs master | Governance | Services billed off the rate card |
| Would recommend % | People | Patient recommendation rate |
Nothing matches that — which is exactly the case the Ask box exists for. Ask us whether your data supports it.
Every combination
Any measure, by any dimension
The dashboards are curated entry points, not the limit. The drill engine composes the combinations at runtime, so a measure you see once can be sliced any way your data supports.
Date, month, financial yearHospital unit
Patient typePayer & payer type
Service group & lineIndividual service
DepartmentDoctorSpecialty
ReferrerWard & classCost centre
Age bandGenderCity, state, pin code
Income groupOccupationDiagnosis & ICD chapter
Discharge typePayment modeCounter & cashier
Supplier & item
A measure it cannot support, it refuses rather than guesses — and the readiness console tells you which field is missing.
See these on your own numbers
A pilot builds every dashboard above on one month of your data, and your team tests the Ask box on real questions.